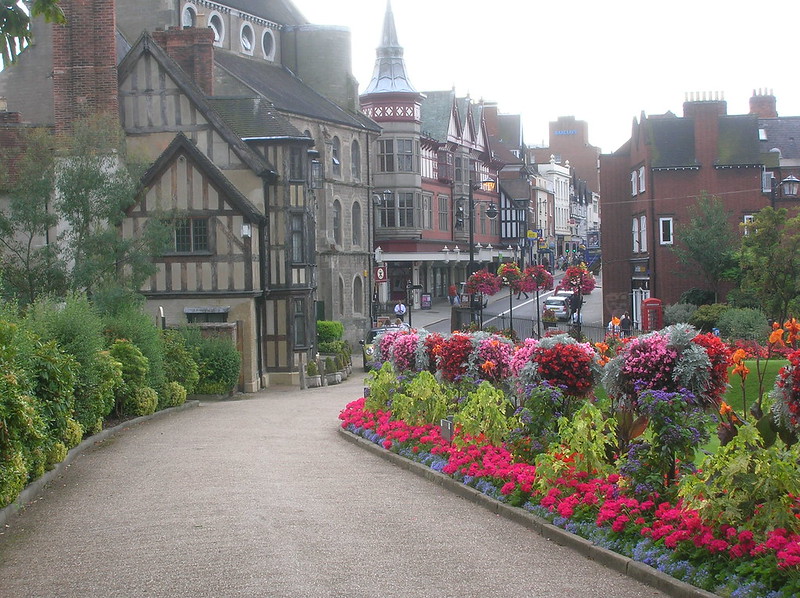
Birthplace to famous historian Charles Darwin, Shrewsbury is shrouded in history and beautiful countryside. With commuters links to London and plenty of transportation links, the village is ideal for people who work in the city.
Over the decade of 2010 to 2019 a total of 66,323 houses were sold according to Land Registry data.
This article aims to identify some of the key trends that occur in house prices in Shrewsbury both in terms of house price brackets, but also how transient each post code area is - in other words, which post code areas had the highest number of house sales.
Shrewsbury house price data by price bracket
Chart of Shrewsbury house sales price data for years 2010-2019
At the start of the decade, the total number of houses that sold in 2010 was 3703. 2010 was the weakest decade for house price growth, this was because of economic and political uncertainty in the United Kingdom.
However, things picked up, and the demand for houses continued to grow. The highest year of house sales was 2016 with a total of 5375, which was closely followed by 2015 with a total of 5312.
At the start of the decade in 2010 the lower end of the property market sold for less than £100,000 the most houses with a total of 347. At the end of the decade, this margin of the property market remained to be the highest bracket of which had the most houses sold with a total of 3797.
The house price bracket that came in second was between £100,000 and £120,000 with a total of 3723 houses being sold. This bracket had one of the largest increases in the number of houses being sold. At the start of the decade only 3650 houses sold, which may have been due to the recession, causing house market uncertainty.
Looking at the more expensive houses sales in Shrewsbury, houses that sold between the 800k-1M was 106 for the decade Houses that sold for 1M+ was 45 overall, the first quarter of 2014 ( 90 days) saw 4 houses sold for that price.
Shrewsbury house price data by postcode area
Chart of Shrewsbury house price data by post code for years 2010-2019
In terms of the volume of house sales in a postcode district, the SY2 postcode district which represents Monkmoor, Sutton, Sutton, Cherry Orchard, and Springfield was overall the area with the highest number of house sales which was 3043 over the decade between 2010 and 2019.
Shrewsbury has a smaller amount of postcode districts with a grand total of 25.
Other postcode areas within Shrewsbury that followed closely behind was SY23, which covers areas that include Aberystwyth, Llanon, Llanrhystud, Ceredigion, with 2888 houses sold over the decade.
Real time Shrewsbury house price information
If you are interested, you can see what the current selling prices for different types of houses & flats for sale in Shrewsbury are here on the Propertyheads website, including 4 bedroom houses to buy, 1 bedroom flats for sale and also flats and houses to rent.
We also have a number of Shrewsbury estate agents who are available to chat through your property needs using our innovative messaging facility.
Added: July 31, 2020 08:03:15